This is the same network that I used for Hw 7. The small network above is a filtered correlation network created from the S&P 500. I grabbed the close prices from all s&p 500 stocks for 2021. I then created a correlation matrix from those prices. I then created ties for stocks that were 98% correlated. This filtered down the list of 500 stocks to 32 stocks. I then filtered out any isolates.
CUG-tests to Test Network Properties
I first need to change my network objects into adjacency matrixs.
small.mat <- as.matrix(as_adjacency_matrix(small_network))


small.cug <- sna::cug.test(small.mat,FUN=gtrans,mode="digraph",cmode="size", reps = 100)


small.cug
Univariate Conditional Uniform Graph Test

Conditioning Method: size
Graph Type: digraph
Diagonal Used: FALSE
Replications: 100

Observed Value: 0.4322034
Pr(X>=Obs): 1
Pr(X<=Obs): 0 plot(small.cug)
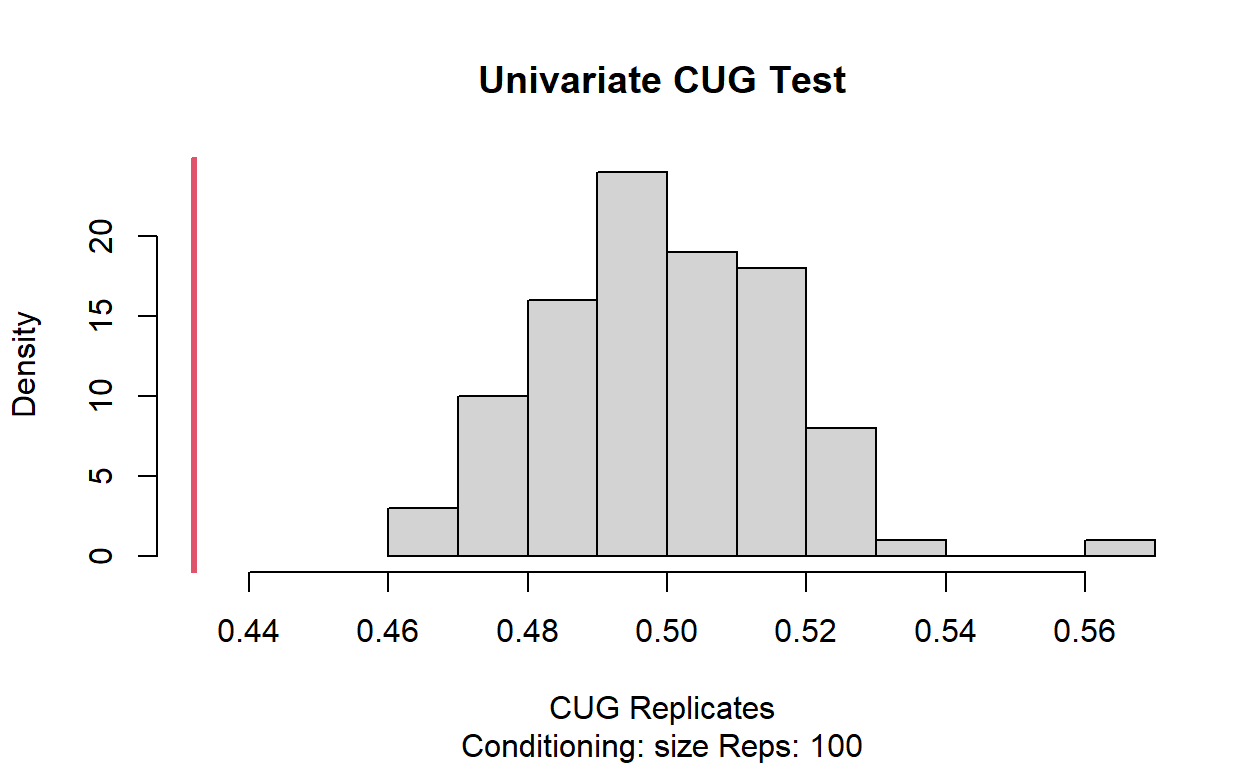
[1] "The T stat: -4.09960327592022"There is a low probability the transitivity can be randomly generated.
Creating T stat funciton
Cug test to different Network Properties
Degree
small.cug <-cug.test(small.mat,FUN=centralization,  FUN.arg=list(FUN=degree, cmode="indegree"), mode="digraph", cmode="size")
#plot vs simulation results
plot(small.cug)

paste("T Statistic: ",cug.t(small.cug))
[1] "T Statistic: -1.03322042697641"There is a good probability that the degree could be randomly generated.
Betweenness
small.bet <-cug.test(small.mat,FUN=centralization,  FUN.arg=list(FUN=betweenness, cmode="directed"), mode="digraph", cmode="size", reps=100)
#plot vs simulation results
plot(small.bet)

paste("T stat: ", cug.t(small.bet))
[1] "T stat: 37.733590672985"There is a very small probability that the betweeness could be randomly generated.
Transitivity
small.trans <- cug.test(small.mat,FUN=gtrans,mode="digraph",cmode="dyad")
small.trans
Univariate Conditional Uniform Graph Test

Conditioning Method: dyad.census
Graph Type: digraph
Diagonal Used: FALSE
Replications: 1000

Observed Value: 0.4322034
Pr(X>=Obs): 0
Pr(X<=Obs): 1 plot(small.trans)

paste("T stat: ", cug.t(small.trans))
[1] "T stat: 7.6129532301842"Edges
small.edge<-cug.test(small.mat,FUN=gtrans,mode="digraph",cmode="edges", reps=100)
small.edge
Univariate Conditional Uniform Graph Test

Conditioning Method: edges
Graph Type: digraph
Diagonal Used: FALSE
Replications: 100

Observed Value: 0.4322034
Pr(X>=Obs): 0
Pr(X<=Obs): 1 plot(small.edge)

paste("T stat: ", cug.t(small.edge))
[1] "T stat: 16.395883128983"